(Talk delivered at the Moravian Archives, Bethlehem, PA in 2014)
The desire to measure, quantify, describe and represent the place in which we find ourselves is one that has been with humans for a long time. In the eighteenth century, landscape paintings emerged as a genre that allowed the landscape to be a presence of its own when it was considered to be both a topographic and a decorative entity. The genre flourished in the century in which the Moravians were building their missionary efforts around the world: in Greenland, the Caribbean, and North America, inter alia. The Moravians left behind them not only kept copious written records of their activities around the world, they also mapped and surveyed many of the areas where they settled. In their schools, they educated their pupils in the geography of the world they might well travel to as missionaries with atlases of carefully drawn maps. The question of land, landscape, and land usage played an important role in the construction of Moravian “place,” especially during the periods of first contact and settlement. As Edward Casey claims, the interest in topographical painting and mapping reflected a wide spread curiosity about the New World, especially and understandably by those Europeans who were considering emigration to America.
The first Moravian topographical artists were engravers by training whose attention to detail served the needs of increased graphical representation of topology well. Valentin Haidt, trained as a silver chaser, although best known for his portraits and devotional scenes, provide the viewer with some interesting background scenes of the wilds of Pennsylvania in his paintings. The eye for detail of the engraver serves not only the linearity and exactitude of topographical painting, it also actually etches into the perception of the viewer the traces of representation.
Here we focus on some of the Moravian maps of Pennsylvania from the 18th century (specifically around Shamokin). These maps are from the Unity Archives in Herrnhut, Germany and the Moravian Archives, in Bethlehem. They provide us not only with a perspective on Moravian notions of “place,” but also how they can be teamed with 21st-century mapping technology to provide crucial assistance in identifying the spaces of the past. The topographical collection in Herrnhut held some surprises: not only were there maps drawn up by master Moravian cartographers, such as Golkowsky, whose work is included here, but also very famous, highly valuable maps from the 17th century, such as the one by Justus Dankers, a copy of an original by Claus Vischer. [Slide 3]
This map, drawn as an advertisement to those seeking to immigrate to North America, is best known for its depiction of New Amsterdam in the 17th century. However, what of interest to the study of Moravians, is the depiction of Pennsylvania. [Slide 4]. The drawings (colored and embellished from the original map by Dankers) show in quite accurate detail the pallisaded towns of the “Mohicans”, who given the location of the settlements (just below the brown bear and polar bear) indicate that they are probably Susquehannock. [Slide 5] The larger detail of the Susquehanna River and the Chesapeake Bay reveals the location of many of the Native American peoples prior to their forced removal westwards and north during the contact period with Europeans. For example, the Tockwocks and the Conoy are pushed further upstream and settle briefly in Shamokin at the Confluence of the Susquehanna River in the 18th century. The map is therefore an interesting mixture of description, projection, and experience. This is a place of wonders, of peoples, of fantastic animals, and rich colors and resources. The map, avoiding the drive for “placelessness” or objectivity that became the norm of the enlightenment mapmakers, still allows the viewer today a glimpse into the experience of the traveler of the 17th century. [Slide 6]
My search for representations of the Confluence led me also to paintings [Slide 7], especially to this newly restored copy of an original painting by Valentin Haidt that originally hung in the stairwell of Lindsey House in London, and then later in the Moravian Chapel in Fetter Lane, until it was destroyed during the Blitz of 1941. This copy, painted in the 19th century, now is in Herrnhut, depicts Zinzendorf, Conrad Weiser and the chiefs of the Five Nations as they exchange gifts and agreement that Moravian missionaries should be allowed to enter Iroquoia. Although this meeting took place in Tulpehocken, close to Weiser’s home, the landscape in the background of the painting is not that of the district around there. [Slide 8]. Although usually the focus of attention in this painting has been on the actors [Slide 9] and the detective game of identifying who is who (including Zinzendorf in glasses) my focus is on that background. [Slide 10] The hills come down to what appears to be a river, the banks of which have settlements. If we were to stand at the confluence of the North and West Branches of the Susquehanna River in what is today Sunbury and look north, this is what we would see. The question as to how and why Haidt would have painted that as a background rather than the topography that surrounds Tolpehocken remains open, but the attribution fo this place to Shamokin is also given by the Pennsylvania Historical and Musuem Commission in their fascinating book “The French and Indian War in Pennsylvania 1753-1763” by Louis Waddell and Bruce Bomberger (1996). So, my interest was piqued—was this the confluence?
[Slide 11] In order to pursue this question and to follow the routes of the Moravian missionaries in the eighteenth century I turned to some of the other maps in the topographical collection in the Unity Archives and to the wonders that are of the 21st century: namely, Google Earth and GIS-Geographical Information Systems—a piece of powerful software that allows one to make maps consisting of multiple layers of information: hydrological, topographical, statistical (such as census data), historical (data pertaining to archaeological digs, past settlement patterns), meterological (inserting weather patterns such as floods, storms, droughts) and scientific (flora and fauna). While scientists have used GIS for a while now to show a variety of special relationships between perhaps weather and flora, global warming and ice cap size, this tool has only recently begun to be used by social scientists and humanists. I am fortunate to have several colleagues at Bucknell who are expert practitioners of GIS (one, Ben Marsh whose work we will see later in this presentation, just had his GIS mapping cited by the inventor of the World Wide Web, Tim Berners-Lee in a presentation on the importance of open data—Ben had made a map of Zanesville, Ohio to show the relationship between race and water company service that won the claimants a multimillion dollar settlement). And when I showed them some of the maps in the Unity Archives, they salivated… and we got to work.
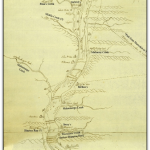
First, though, we need to look at how information was presented by the 18th century Moravians on their maps. How places, terrain, distances, people are depicted is important to an understanding of how and why Moravians mapped. For example, a detail of this familiar map of Pennsylvania [slide 12] –And what are those places that are of interest to the Moravians? Those underlined in green are places owned by the Brethren, such as Bethlehem, Nazareth, Friedensthal, Gnadenthal, and Gnadenhütten; those underlined in red, are settlements, places of worship and schools, such as Emmaus, Oley school house, and Danesbury; those underlined in blue are families that are connected with the Brethren, such as in Friedrichstown, and those underlined in yellow are inns and way markers, such as the Cedar Mill, the Milk Pan, the cooking spoon, or more explicably Conrad Weisers house, or Daniel Lavant’s. [Slide 13] On the same map, we have the route taken to Shamokin, the site of the Moravian smithy from 1747-1755, overseen by Shikellamy and the Five Nations of the Iroquois, until the outbreak of the French-Indian war in 1755. Here we see the paths taken by the missionaries, traders, native americans and Zinzendorf and his party in 1742 as they went from Conrad Weiser’s house in Tulpehocken to meet Shikellamy in Shamokin. The waymarkers are of interest: named by Weiser and Zinzendorf on that 1742 journey, they are Erdmuth’s Spring, Ludwigs Ruh, the Double Eagle, Jacob’s Heights.
On this GIS map, created last summer by one of Ben’s students, Emily Bitely, for a project sponsored by the Friends of John Smith. We can see how a GIS map is created from various sources.
These routes can be followed in the text of Zinzendorf’s journeys among the Indians, most recently republished in “Zinzendorf and the Indians” Wennawoods, 2008. But Zinzendorf had his own map [slide 15] Johanans Reisen unter die Heyden” Karte der drei Missionsreisen des Grafen N. L. von Zinzendorf in Pennsylvania mit Entfernungsangaben 1742. Here is Zinzendorf’s representation of his journey among the heathen of North America—we know that it is his map because he thought he was travelling through Canada when he crossed north of the Susquehanna River. [Slide 16] And if we take a detail of that map and blow it up, compare it to the GIS map of that section we can line up the terrain in an approximate fashion. [slide 17] On the reverse side of Zinzendorf’s map we find the distances between points on the map, the totals travelled, and also descriptions of the terrain, rocky and steep, along with the story of the snakes (btw, Europeans are fascinated with snakes in the New World, they always refer to them as a sign perhaps of danger, as an icon of a pre-lapsarian innocence or the ubiquity of Satan’s temptation). So here, on this definitely non-isomorphic map of Zinzendorf’s travels we find narrative and experience, two of the features of mapping place that still elude the expert GIS cartographers of the 21st century.
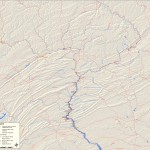
[slide 18] But let us take a closer look at the travel map of 1752. (typo on slide) For my present purposes, working on the Shamokin Diary, this is a wonderful map—it shows me where the missionaries stayed on their route form Bethlehem to Shamokin; it shows me the location of the closest flour mill to the mission, Quitapahilla in the Lebanon Valley, it shows me the rest stops, and way markers along the path that measure out the route that was well trodden by Native and European peoples in the Colonial period. So, where are these waymarkers on a topographical map?
[slide 19] This geo-referenced map has taken the 1752 travel map and tried to pin it at various common points on top of a hydrological and topographical map.
[slide 20] The arrows show us how much distortion there is to the original map in order to make it fit. This can show us how accurate or inaccurate the historical map is compared to today’s map. However, one of the questions that critical cartographers are asking today is how can we distort the maps of today, that are designed to be drawn from the perspective of no-one and nowhere, to actual highlight the standpoint of the observer ( we will see one of those standpoint maps from the 18th century on slide 29).
[slide 21] Again, if we zoom in on the Tulpehocken Path, we can see how the two maps do and don’t match up.
[Slide 22] To go back to the question of non-isomorphic mapping, to the map of experience rather than representation, we could argue that the schematic map gives us the skeleton of a journey: it’s the kind of map we might draw on the board during class to show the rough relation of places in space to each other and also a route we might have taken through the terrain. This is Zinzendorf’s sketch of his journey to Shamokin in 1742, which is included in the manuscripts of the Shamokin Diary here in the Archives. Pretty bare…
[Slide 23] In 1745 Bishop Spangenberg traveled from Bethlehem to Onondago, the capital of Iroquoia, to meet with the Chiefs of the Five Nations. There is a published account of his journey in the Moravian Journals in Central New York (recently republished and available in paperback at the MHS bookstore in Nazareth.) Here is Spangenberg’s schematic map of his journey, showing directions and distances, and way markers. When I first found this map here in the archives I was struck by its simplicity, but also by the name of one of the points on the map… the “Coffee House”. What, I thought, a Starbucks in the Tiadaghton Forest????
[Slide 24] So I mapped the journey on Google maps, and tried to work out the location of the coffee house– hmm, the middle of the forest… and then after researching in several other locations, I realized that this is one of the ways in which travelers along the paths knew where they were going—a pile of rocks, a junction in a path, a viewshed, a tree… the coffee house might still be there, but it is probably still not serving lattes…
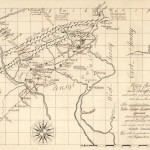
[Slide 25] As I delved further into the topographical collection in the Unity archives I came across maps that could solve puzzles. This particularly beautiful map from 1739 (that is before Zinzendorf’s arrival) is by an English cartographer and details the Delaware and Susquehanna Rivers. On the small thumbnail that is displayed on the website of the Unity Archives, I could see that there was writing all over the map at various strategic places, but it was completely illegible. Only once I received the high resolution image of the map was I able to decipher it.
[Slide 26] In addition to the location of Native settlements along the river, I was able to decipher the following paragraph… a claim, verified by my work on the Shamokin Diaries and also by local historians, who have long claimed that the land around the confluence was given to Conrad Weiser by Shikellamy as the result of them both having the same dream in one night.
[Slide 27] The purpose of the map appears to have been to clearly map the disputed border between Maryland and Pennsylvania. Once the image had been sharpened, and the colors contrasted more, the writing along the disputed border became clearer.
[Slide 28] The depiction of the Chesapeake Bay, here compared to a contemporary map from the Friends of John Smith, showing John Smith’s explorations of the Bay in 1608, reveals the accuracy and detail of the 1739 map.
[Slide 29]
But to return to imaginary mapping. This wonderful scene of the Moravian settlements around the world from 1758 hangs in the Whitefield House in Nazareth. It is notoriously difficult to read, even with the handy printed guide, the location of settlements on the map are at times illegible. However, the digital image allows us to zoom in on scenes that are adjacent on the map, even though they can be thousands of miles apart geographically. [slide 30] For example, Barby is depicted as next to Greenland, and just above two [slide 31] Caribbean missions of St John and St. Thomas. I would love to find out more about the origins and purpose of this depiction of Moravian missions, foreshadowing as it does the very famous New Yorker cover of the world from Manhattan.
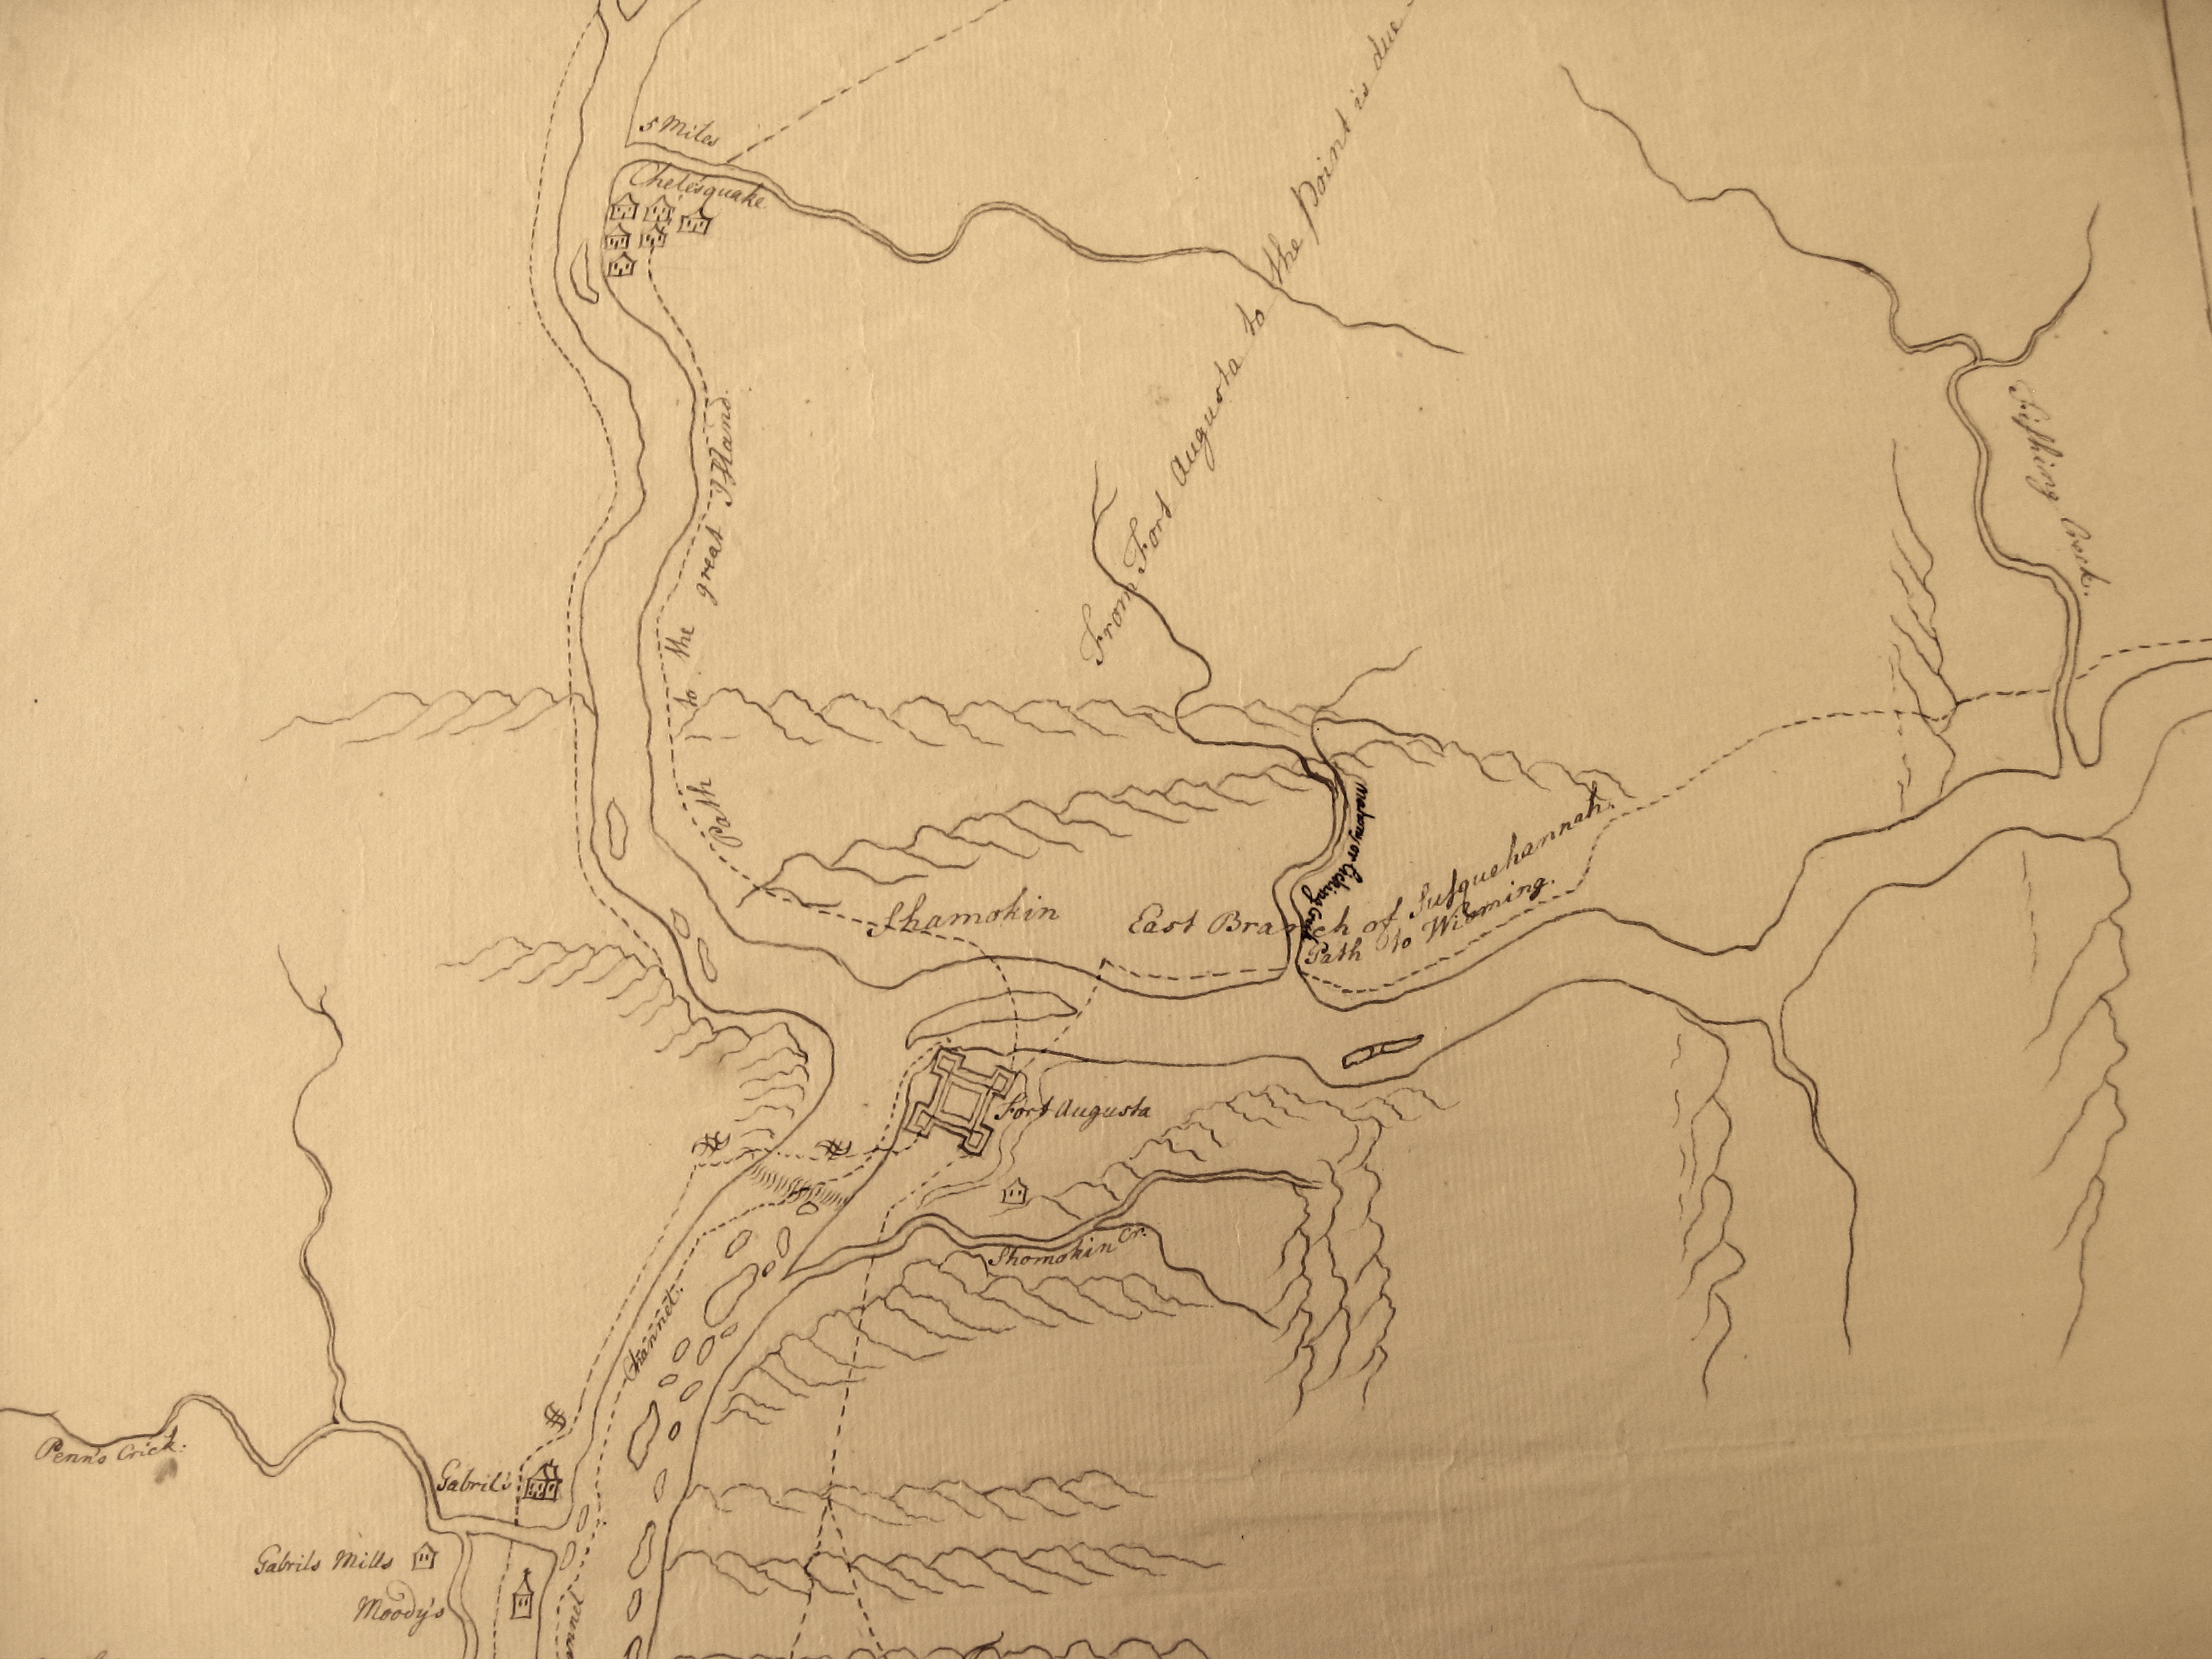
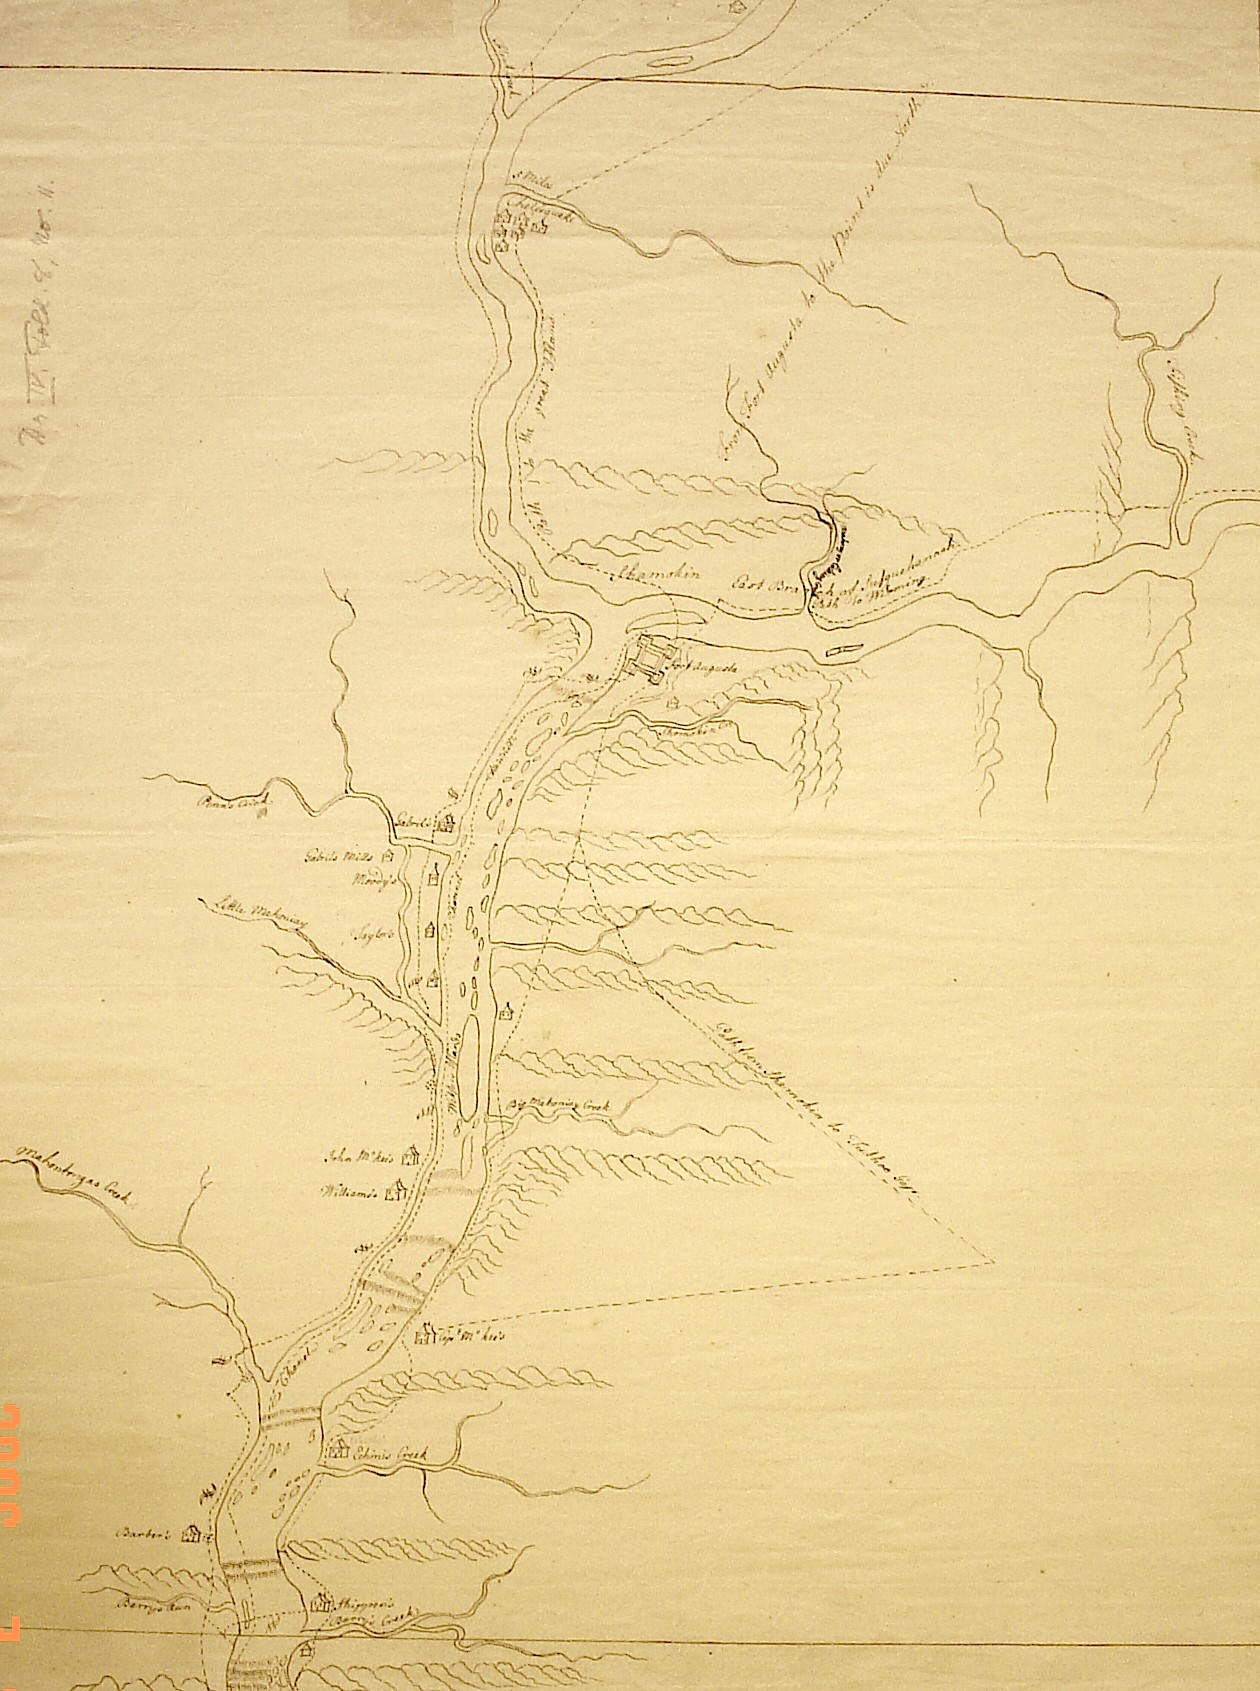
[Slide 32] To return to the confluence though. This is the map I discovered here in the Bethlehem archives, a few years ago. [slide 33] It is in four pieces that fit together like a a jigsaw and make sense only if you know how the river twists and turns in the wilds of Pennsylvania, turning back on itself and making horseshoes of hydrology.
[Slide 34] The portion of the map that is most detailed is that which stretches from Harris’ Ferry to the Confluence and that should have been a clue as to its purpose. Each house is marked, each island in the river, dotted lines seem to represent paths and channels through the water. At points on the map there are strange hash marks. [Slide 35] Georectification was not very informative, questions to locals who have walked every mile of these routes along the river did not give me more than conjecture.. portage points? Safe places to tie your canoe? Fords?
It was not until I made a high resolution image of the map last week that I was able to discern that the marks indicate the route taken along the river by Colonel Clapham in 1756 with the equipment and materials to build the forts at the Confluence and the mouth of the Swatara Creek. There is an account written by him of this journey in the History of Dauphin County. But, why is this map here? Why is it not in the Archives in Harrisburg? Why has it not yet been discovered by the authors of the work on the French Indian War in Pennsylvania? Why has it never been published?
I am going to end my presentation with a success story that will hopefully inspire us to make available and accessible the treasures of maps that are in the archives here, in Bethlehem, Nazareth, and Herrnhut and probably many other archives as well.
Four years ago I gave a short paper on the Susquehanna River and the European imagination at the first River symposium at Bucknell University. My research on Shamokin had just begun and my focus was on the printed sources I had found—Goethe’s poem on the Susquehanna, Zinzendorf’s descriptions of the river as he travels to Ostonwakin from Shamokin with Anna Nitschmann . In the audience was David Buck, of the Susquehanna Greenway, from Wyalusing. He asked me what I knew about Friedenshütten, the Moravian village on the North Branch. At that point, I knew little. But, never one to be satisfied with ignorance, I searched and found this spectacular map in the topographical collection in Herrnhut. [Slide 36] Its color, detail, accuracy are breathtaking. I went to Wyalusing and showed the local town corporation the slide in high resolution; we went to the site of the settlement with print outs of the map and walked the field by the river that is marked today only by a plinth erected in the late 19th century. I came back to the archives and found the original sketch of the map that was drawn by Johannes Ettwein, [slide 37] also detailed enough to show which of the cabins in the village were log and which were Indian bark houses. [slide 38]
Eager to learn more about the map, its purpose, origins, and accuracy, I shared it with my colleague Ben Marsh, who was stunned. So we sat down at his computer one afternoon and he led me into the mysteries of ARC GIS and georeferencing.
[slide 39] First it was his turn to blow my mind with a 3 dimensional layering of the historical map with the present day topography. From this map, and details from it, groups in Wyalusing have been able to find the trail head of the path from the North Branch to the West Branch, taken in 1772 as the settlement was evacuated.
[Slide 40] Through layering and georeferencing the historical map of the village it was revealed that the railroad had been built through the settlement.
And then finally, we [slide 41] put this into motion.
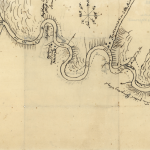
Here are the maps of the area around Shamokin
One thought on “18th-Century Moravian Mapping”